How I used open data to bolster a story on dangerous housing violations in NYC

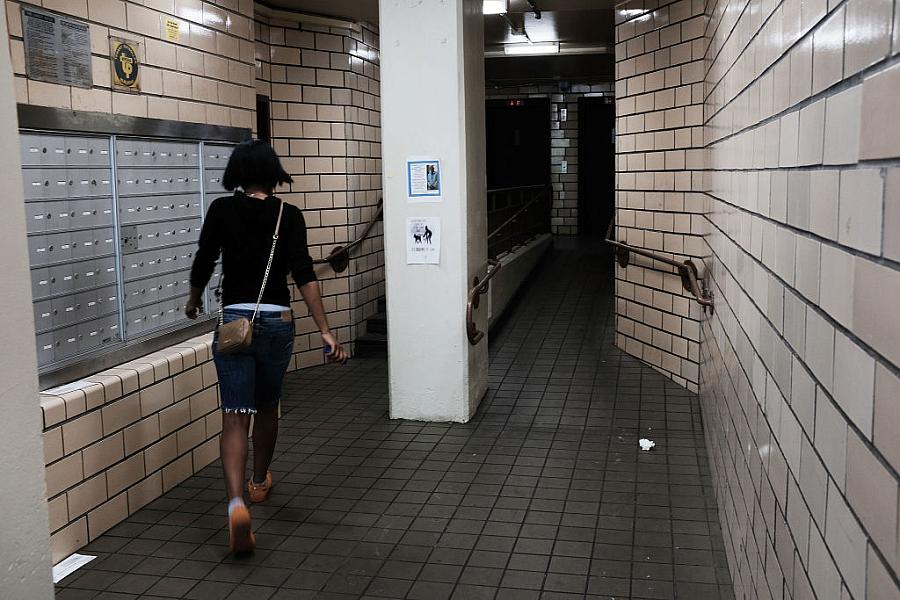
Photo by Spencer Platt/Getty Images
Court documents had led me to a group of renters in Harlem who sued their landlord in 2022 for multiple housing violations, including fire hazards. The residents sued after a deadly fire the previous year killed three tenants in the building.
According to residents, there were missing smoke and carbon monoxide detectors, which are required in NYC rentals. The devices cost as little as $10 and if functioning properly can warn dwellers to escape before smoke from a fire becomes unbearable. The tenants argued that housing violations that went unaddressed for years exacerbated the harm of the fatal fire.
Interviews with surviving tenants, along with court records, painted a narrative of that unfortunate night. But I knew to better understand the long-standing health and housing disparities in a neighborhood such as Harlem, I needed data to quantify these inequities.
Prior to working on my health series on carbon monoxide poisoning, I didn’t have much experience reporting on housing. But through sourcing with advocates, medical staff, renters and lawyers, I learned about key data sources that would help produce a story that touched on history, demographics, real estate and health.
The use of publicly available data allowed me to tell a story that went beyond one building on one block in Harlem. I was able to report a larger story, with support from the 2022 Data Fellowship, about how unsafe housing conditions in New York City can lead to devastating health outcomes.
Here are the open data sources I used to power my storytelling.
1) Census data
Through my data fellowship, I learned the value of getting census data at the hyper local level: census tracts, ZIP codes and community districts in New York City.
By using the tool Census Reporter, which makes data from the American Community Survey more accessible, I learned that nearly a quarter of Central Harlem’s residents are immigrants. I was also able to drill down on the scope of rental units in the neighborhood.
In addition to Census Reporter, data from an academic research center helped me calculate the rate of carbon monoxide-related housing violations by borough. This information pointed me in the right direction when it came to looking for problem rental units in the city.
The data from these two sources contextualize how residents of color and immigrants are disproportionately affected by poor housing conditions, including lacking smoke and CO-detectors.
2) Local government reports
By communicating with the city’s department of Housing Preservation and Development, I learned about the latest New York City Housing and Vacancy Survey, which added context to my reporting that Black and Latino renters, regardless of income, make up the largest percentage of tenants with three or more home maintenance deficiencies in their rentals. Those deficiencies can affect health including mold, peeling paint and water shutoffs.
This data point strengthened quotes from tenants in the building who described ongoing issues, including a broken elevator, leaky sink and not having a refrigerator or stove when one tenant first moved in.
3) Violation data
Through the city’s housing portal, I looked up the building’s history of complaints, violations and litigation. I also verified property address and owner information. This led me to other city documents which helped me confirm when the building was purchased.
The violation data substantiated the longstanding safety complaints residents had about their apartments as well as their complaints and attempts to get fixes to their homes.
In addition to this portal, by reading the city’s Housing Maintenance Code, I learned more about the types of housing violations as well as the cost to property owners and landlords for not abiding by them.
And though this aspect of the story didn’t make it into the series, I used a housing advocacy’s online tool to see the web of connections among the building’s owner and other buildings they have a hand in across the city.
4) NYC’s Environment and Health Data Portal
Along with local census data, this city site allowed me to zoom in on health issues that affect Central Harlem. The portal includes neighborhood summaries that explain health indicators including climate, outdoor air quality and housing. Through these reports, I learned that ZIP codes in Harlem rank the bottom third in the city when it comes to carbon monoxide incidents, leaks and peeling paint. Beyond health outcomes linked to housing, the site also analyzes statistics on the racial wealth gap, asthma and injury data.
Even though I didn’t know my way around the NYC housing beat, through guidance from my mentor, the data fellowship and sourcing, I was able to pair open data with documents, quotes and scenes to tell a narrative about housing inequity.