Getting to the bottom of Calif.’s drug-spending increases means overcoming data hurdles


Photo: Joe Raedle /Getty Images
The kick-off interview for my investigation into how pricey drugs cut into California coffers came with a sobering warning.
“There’s a lack of transparency all through this,” said Joel Hay, professor of pharmaceutical economics and policy at the University of Southern California.
“You don’t know anything about these confidential price rebates, and you never will,” he said.
Such was my introduction to the secretive and complex world of pharmaceutical drug pricing. Hay told me the sticker prices of pharmaceutical treatments are almost never what is actually spent on a drug. Health care payers almost always negotiate lower prices, and these rebates are kept secret by private contract and state and federal law. Industry insiders joke about the Average Wholesale Price — or AWP — calling it “Ain’t What’s Paid.”
With key information locked away, the first lesson of my reporting project as a California Data fellow with the Center for Health Journalism was that I had to be creative, flexible and persistent in my data-set sleuthing.
The goal was to uncover if the state was spending more on pharmaceuticals in recent years, and what the impact was. Given that readers would be most interested in how taxpayer money is gobbled up by rising drug prices, I started with Medi-Cal, the state-funded Medicaid program that now covers more than a third of Californians.
Readily available prescription drug spending data, published by the California Department of Health Care Services, is limited by rebate confidentiality, so it doesn’t list final prices paid for drugs. If I had access to those prices on a drug-by-drug level, I could have determined which drugs cost Medi-Cal the most, and analyzed the data further from there. (After several weeks of inquiries, we also found out that this state data set is flawed and unusable in other fundamental ways.)
So the next step was to create original data sets, gathered through multiple public records requests. And, as I found out in my next phases of reporting, price secrecy was not my only obstacle.
Medi-Cal pays for patient care in two different ways. The state pays health plans a fixed rate to manage health care services for members, and for a smaller portion of Medi-Cal members, the state pays providers directly. The portion of Medi-Cal covered by these 22 private insurers — some 80 percent of members — created a huge black hole of information about prescription drug spending.
The Department of Health Care Services said it did not have prescription drug spending data from these plans in a compiled or readily accessible format. It eventually said it could provide the information to us, but not within our timeframe and at a cost of about $1500.
In partnership with Matt Levin, the data reporter at CALmatters, I requested a breakdown of per-member spending on pharmaceuticals in the smaller portion of Medi-Cal (those not covered by private insurers), but it was not representative of per-member spending as a whole.
With prescription and patient-level data flawed or unrepresentative, I decided to ask for data by price point. How has the sheer number of high-cost drugs covered by Medi-Cal changed over the years?
Here we had more luck.
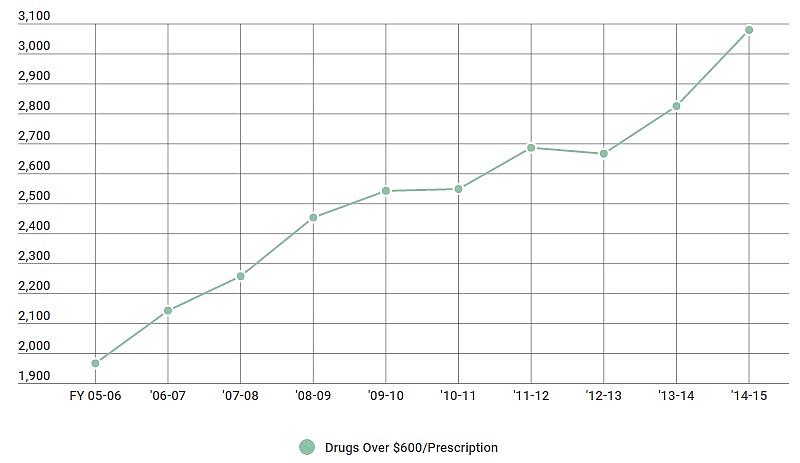
Medicare defines specialty drugs as prescriptions that cost $600 per month or more. We asked Medi-Cal managers to provide data about the number of drugs the program has covered in the last 10 years costing over $600 or more per prescription. That gave us a clean trend line:
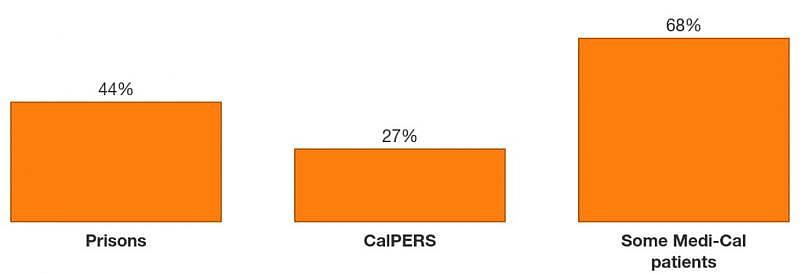
Our work was not finished. We still wanted to put a dollar figure on how much more taxpayers were paying year-to-year given the influx of specialty and other high-cost medications. Because we only knew about spending for about 20 percent of Medi-Cal beneficiaries, we had to get a broader view. So we looked into other California health programs, including state prisons, CalPERS, and the Department of General Services.
Adding up the total spending between agencies was also not simple. The various state agencies compiled pharmaceutical spending differently, some by calendar year, others by fiscal year.
In the end, we reported several key findings that amounted to one bigger picture: Pharmaceutical spending was going up across state agencies, programs were tightening controls on patient access to drugs, and the state did not have an overall strategy for how to balance costs with patient use going forward.
For other reporters covering pharmaceutical stories, I recommend giving yourself plenty of time to find the most meaningful data and understand the complexities of drug pricing. When I say plenty of time, I mean months. This is not a simple topic.
Develop a couple of go-to sources, an economist or academic who is willing to answer questions along the way.
Be creative in troubleshooting how to get the data to tell your story. If that doesn’t work, adjust the story you’re trying to tell.
Don’t be afraid to narrow your scope. Working with a smaller data set can be more manageable, and can still be the lens into a larger trend.
Read Pauline Bartolone's fellowship stories here.